Techno-Economic Analysis Support to DuraMAT
Techno-economic analysis (TEA) helps DuraMAT stakeholders by identifying market-relevant research directions for improved photovoltaic (PV) module and system reliability, durability, and performance.
We achieve this by quantifying the value of these improvements, primarily in terms of levelized cost of energy (LCOE), and also by synthesizing qualitative information about policy, technology, reliability, and market trends from a range of sources (PV market reports, industry interviews, and peer-reviewed literature).
TEA assesses cost and reliability trade-offs for new materials, technology designs, and other industry features, such as policy and deployment trends. Market changes that reduce manufacturing costs can often create new reliability challenges. Tracking technology trends in PV deployment (such as module size, glass thickness, and bifacial share) ensures that we assess the most industry-relevant trade-offs between system costs, performance, and reliability.
We also leverage the PV system cost benchmark published annually by our team and other colleagues as a baseline to compare the costs and performance of emerging trends and research trajectories.
Core Objective
Team Members
Michael Woodhouse, Brittany Smith, and Jarett Zuboy at the National Renewable Energy Laboratory (NREL)
Impact
TEA assesses module and system lifetime economics to identify the strongest options for high-impact reliability research. This includes maintenance of an online LCOE calculator for scientists to quickly evaluate their own research directions. Tracking and analyzing industry trends enables us to inform the research community about the potential reliability and cost impacts of recent policies, technologies, or other changes in the market.
Learn More
The majority of our tools and reports are publicly available.
Publications
Palmiotti, Elizabeth, Martin Springer, Jarett Zuboy, Timothy J. Silverman, Jennifer L. Braid, and Dirk C. Jordan. 2025. "Growing Panes: Investigating the PV Technology Trends Behind Frequent Early Failures in Modern Glass-Glass Modules." IEEE Journal of Photovoltaics 15 (2).
Zuboy, Jarett, Martin Springer, Elizabeth Palmiotti, Joseph Karas, Brittany Smith, and Michael Woodhouse. 2023. "Getting Ahead of the Curve: Assessment of New Photovoltaic Module Reliability Risks Associated With Projected Technological Changes." IEEE Journal of Photovoltaics 14 (1).
Smith, Brittany. 2023. "Estimating the Value of Worker Training: A System Reliability and LCOE Perspective." Presented at the 2023 DuraMAT Fall Workshop, September 26–27, Albuquerque, New Mexico. NREL/PR-7A40-87623.
Zuboy, Jarett, Michael Woodhouse, and Brittany Smith. 2023. "Follow-up From the Photovoltaic Reliability Workshop (PVRW)—Cost Modeling Capabilities To Evaluate Trends in PV Technologies." May 2023 DuraMAT webinar.
Zuboy, Jarett, Martin Springer, Elizabeth Palmiotti, Joe Karas, Brittany Smith, Michael Woodhouse, and Teresa Barnes. 2023. "DuraMAT Technology Scouting Report—Assessing Module Reliability Risks Associated With Projected Technological Changes." Presented at the PV Reliability Workshop 2023, February 28, 2023.
Woodhouse, Michael, Jarett Zuboy, Brittany Smith, Vignesh Ramasamy, David Feldman and Robert Margolis. 2023. "Benefits of the U.S. Inflation Reduction Act (IRA) for Solar PV Manufacturing, System Performance, Reliability and LCOE." Presented at the PV Reliability Workshop 2023, February 28, 2023.
Tools and Other Information
Comparative PV LCOE Calculator
OpenEI: Detailed Cost Analysis Model
NREL: Solar Technology Cost Analysis
Contact
To learn more about this project, contact Michael Woodhouse, NREL.

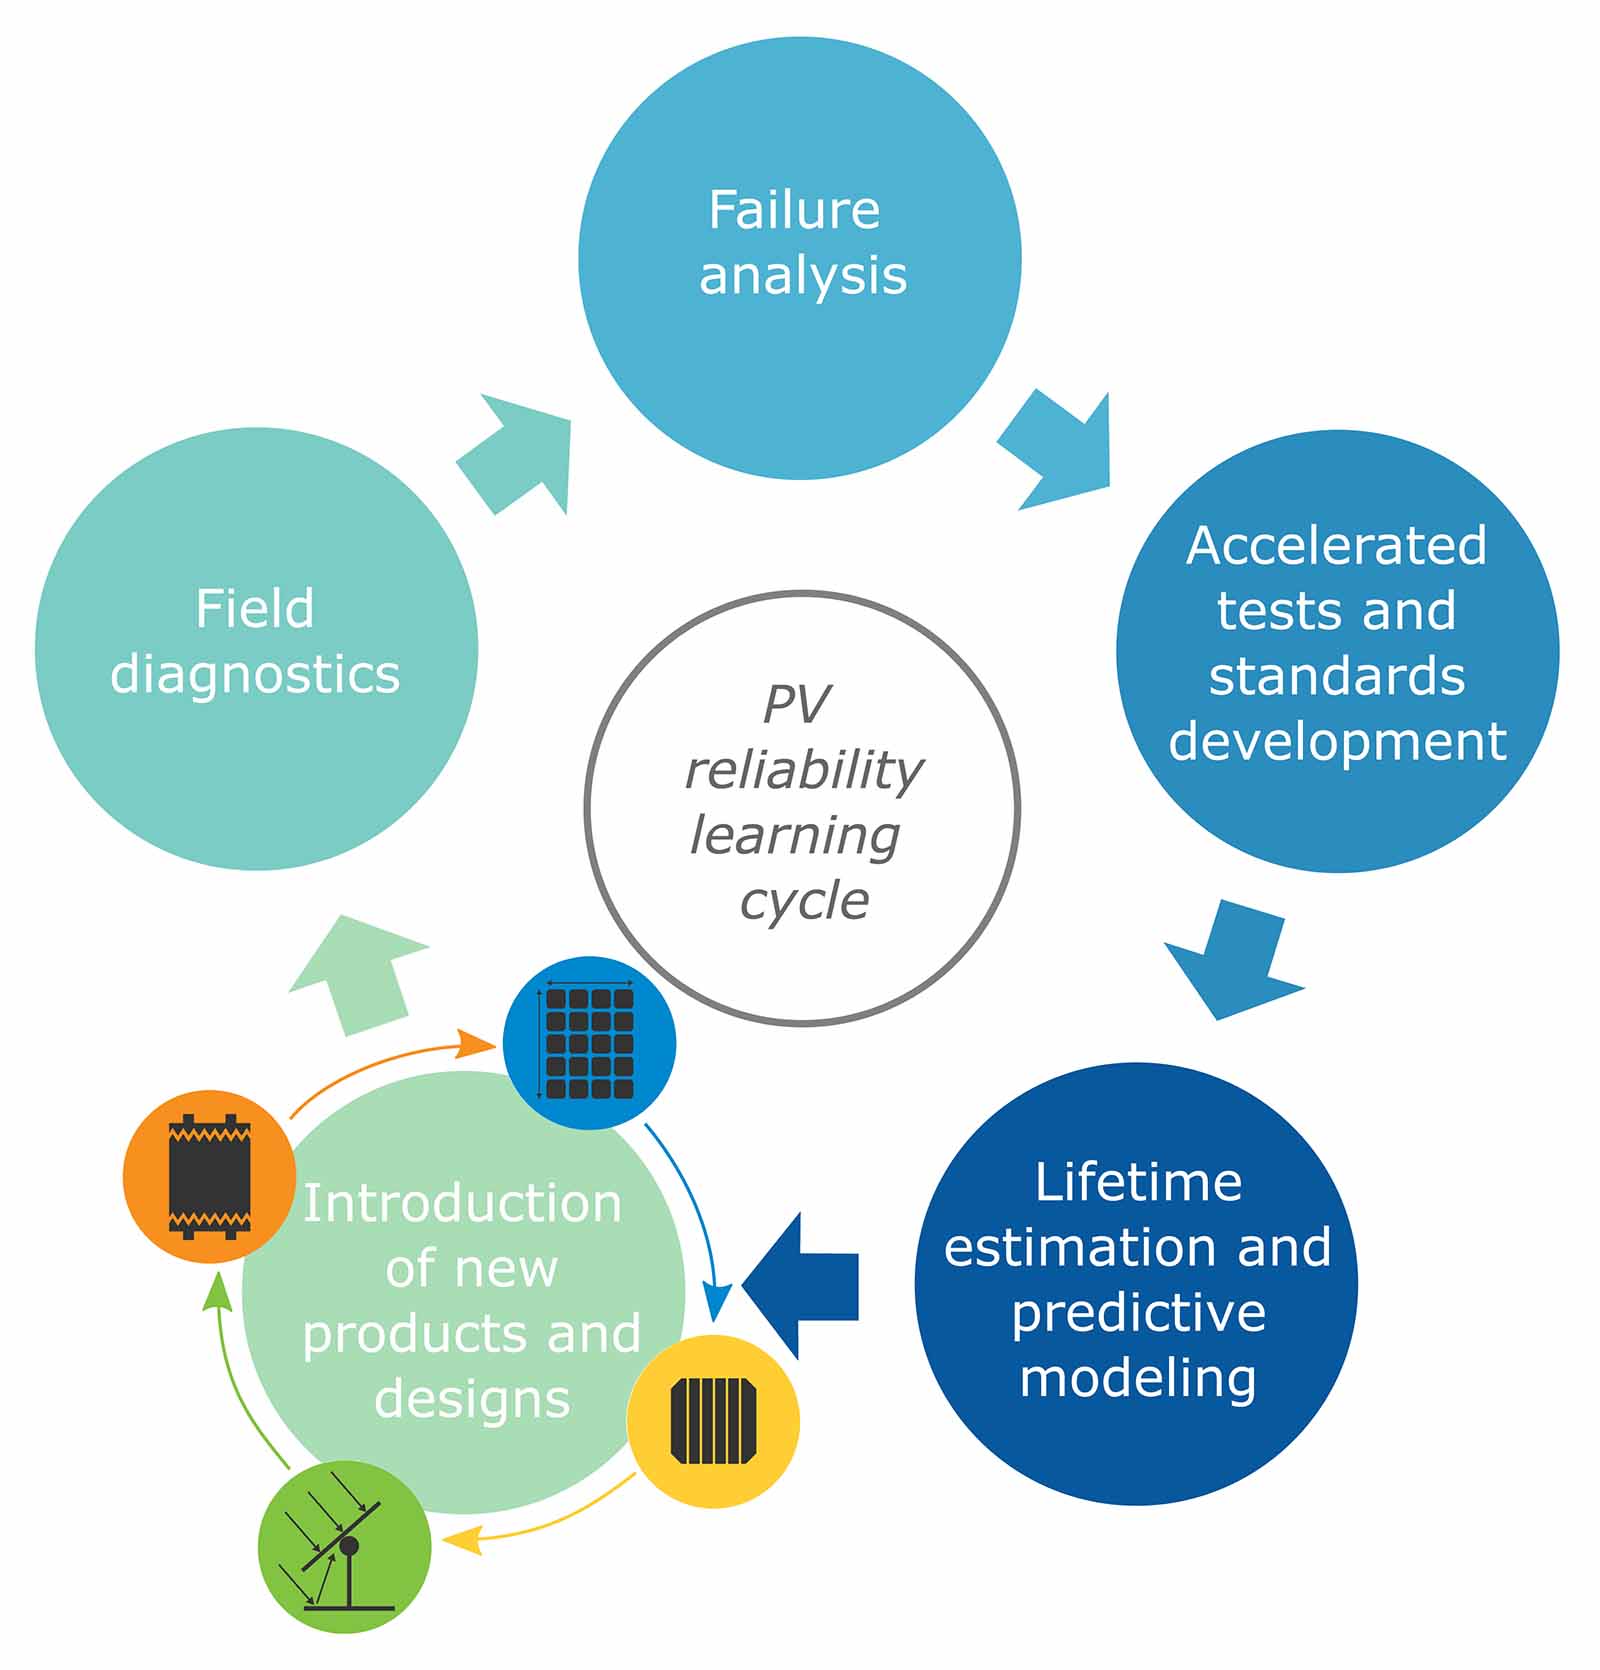
PV reliability learning cycle, enabling continuous improvement despite technological changes.

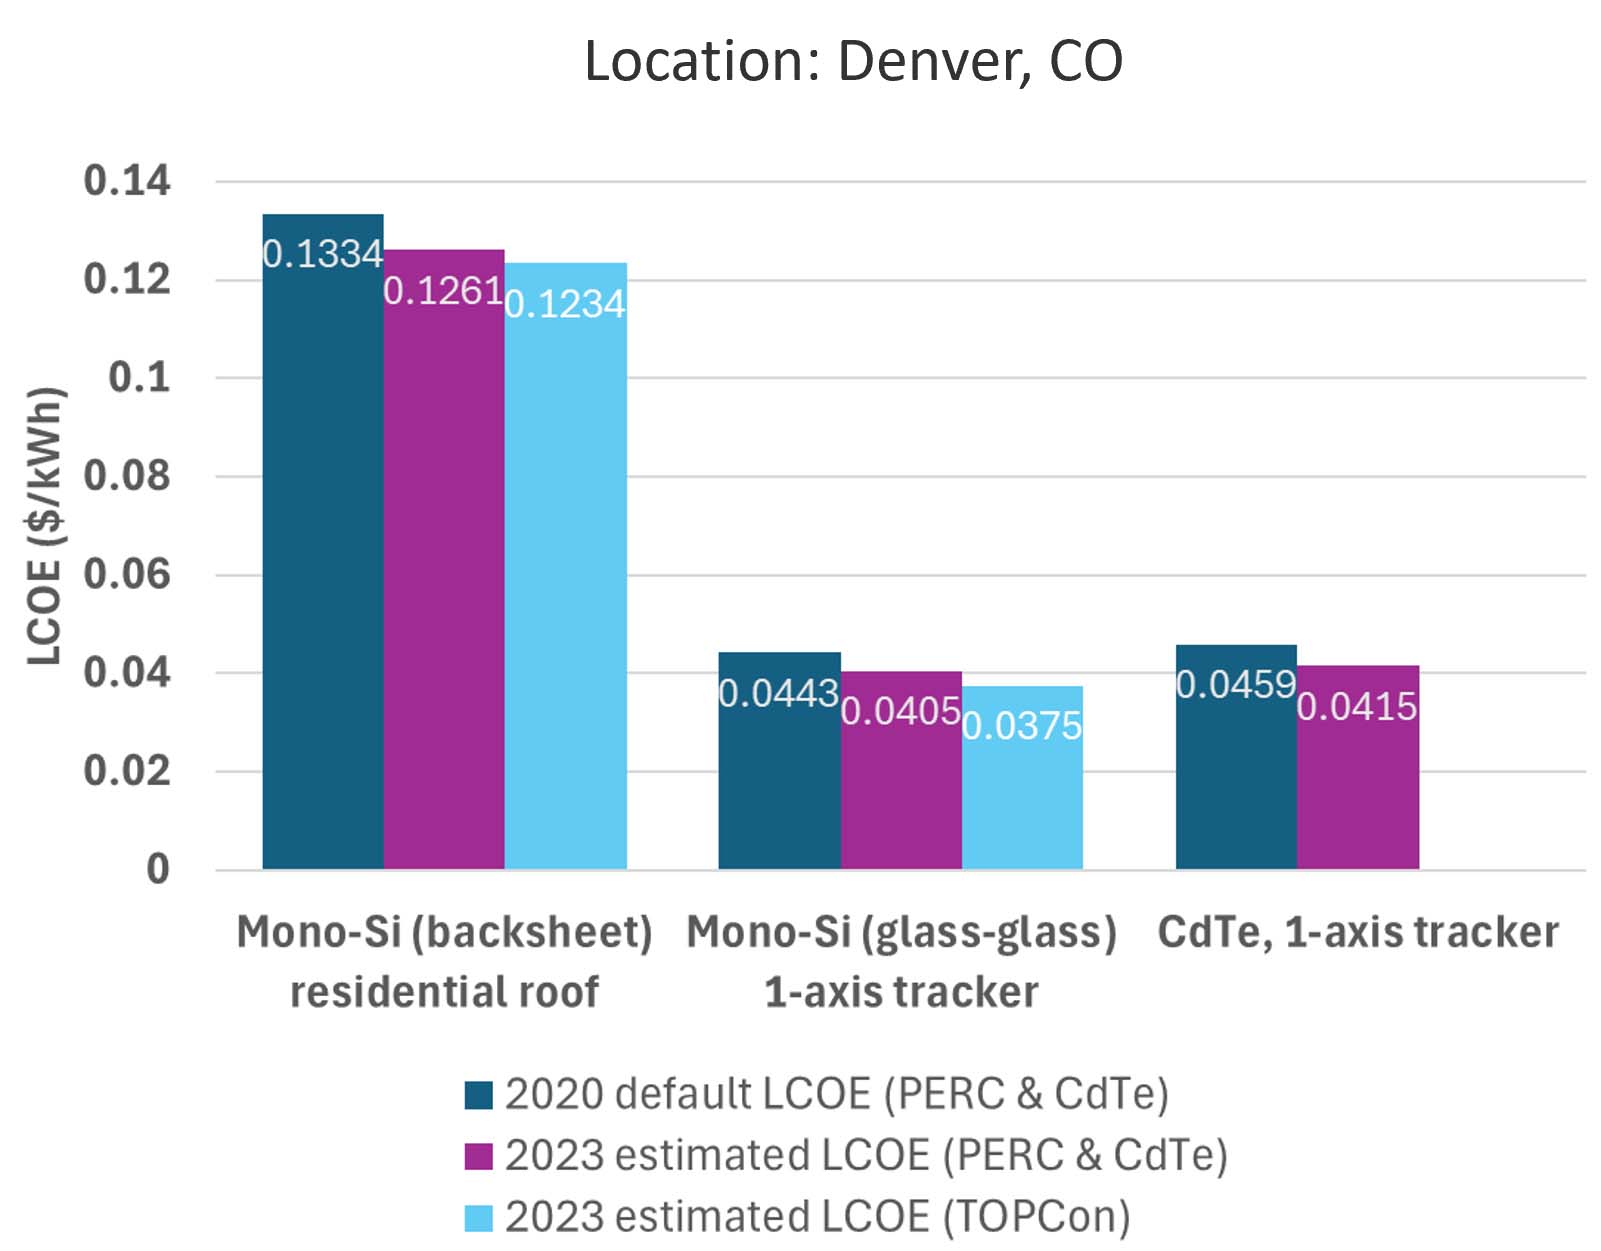
Updated module efficiencies and cell architectures in the online LCOE calculator show lower LCOEs.

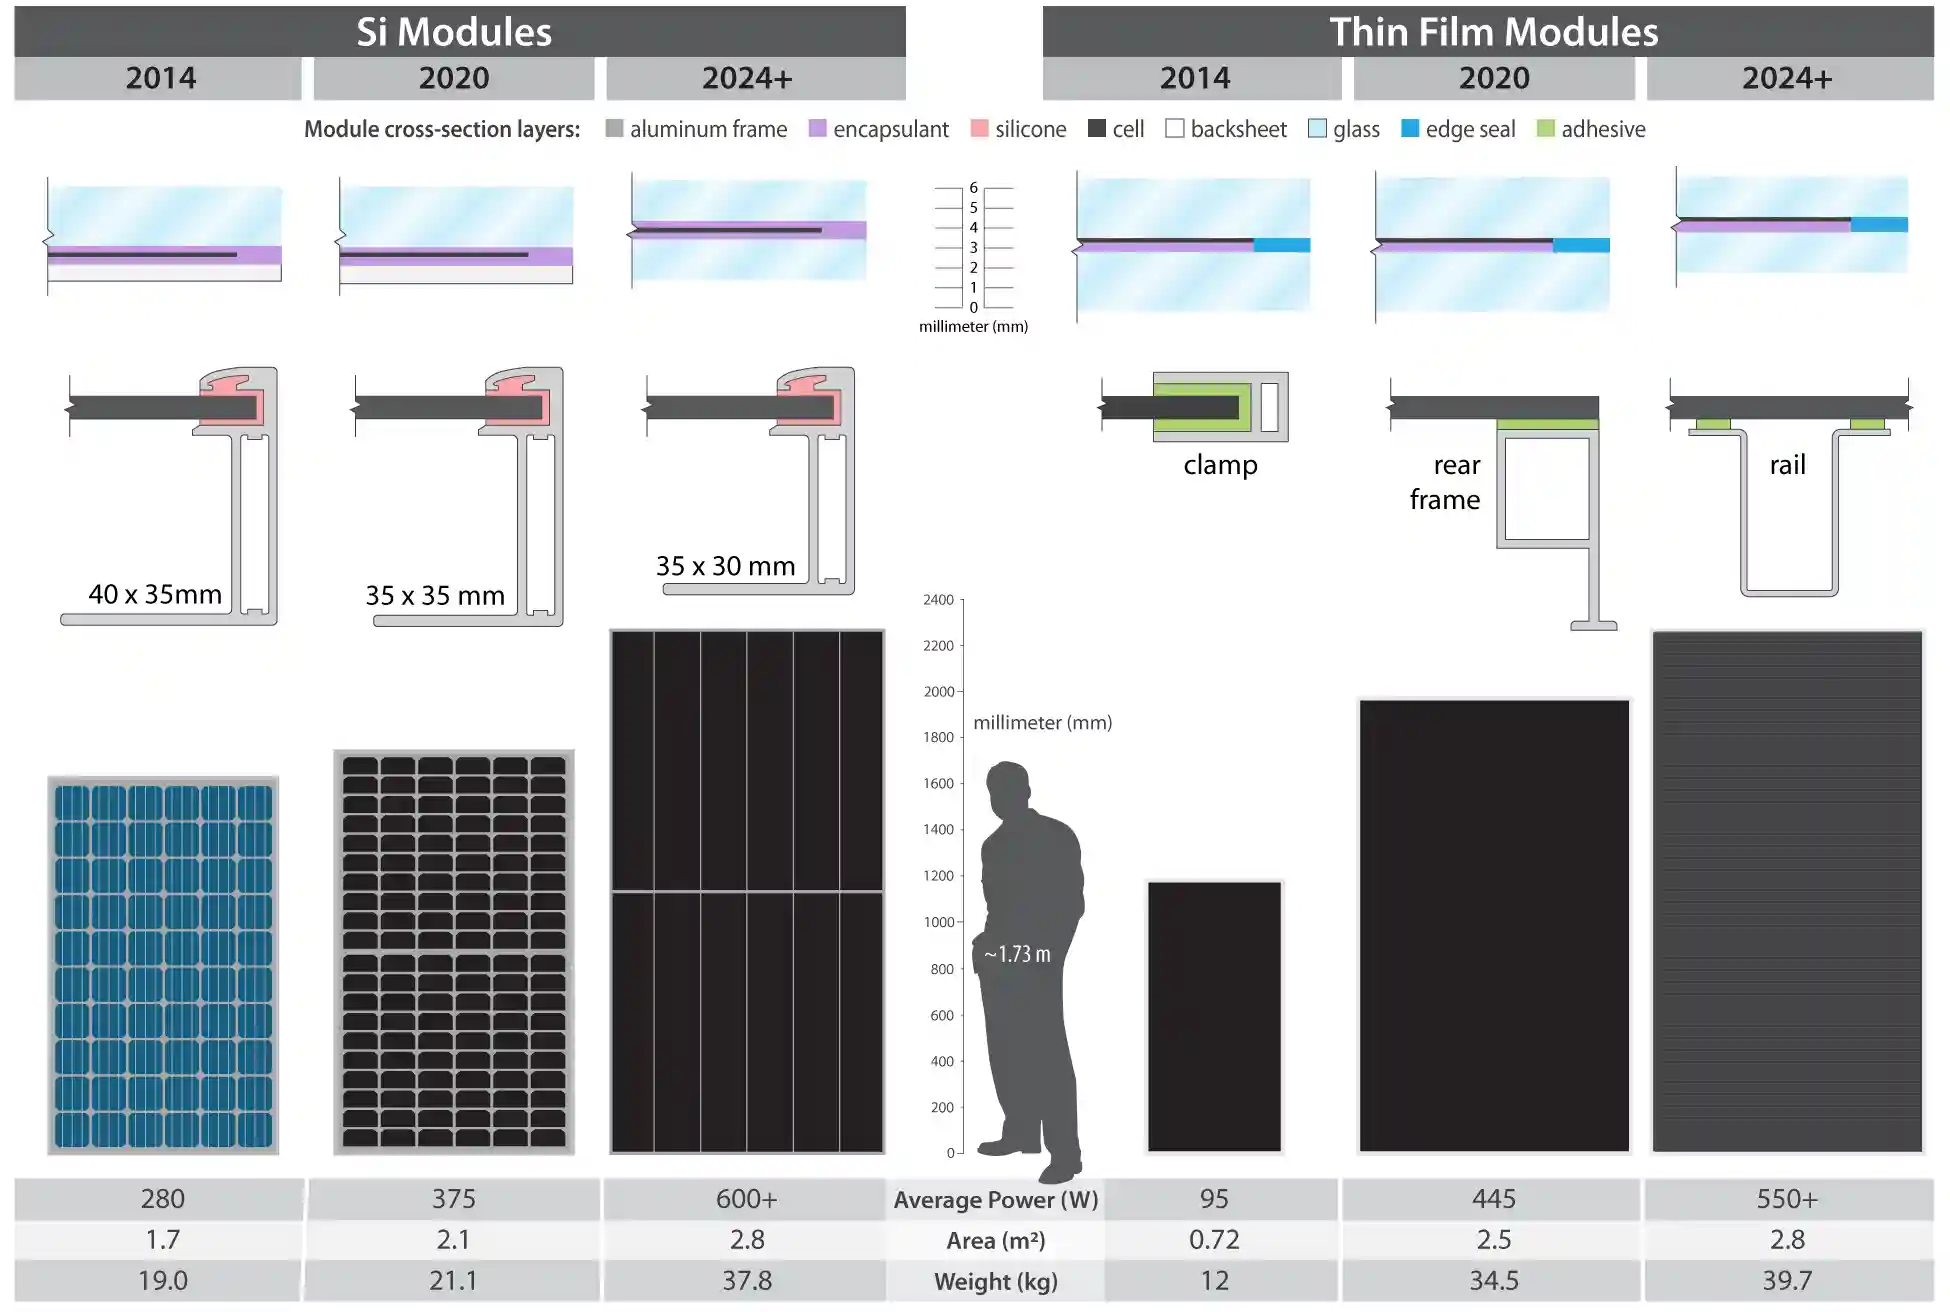
Summary of crystalline silicon and thin-film utility-scale module trends.
![Crystalline Silicon Module Evolution Crystalline Silicon Module Evolution: 2014 (3 busbars, back encapsulant [same as front], polymer backsheet, junction box, AS-BSF cells [monofacial], fixed-tilt structure), 2020 (aluminum frame, frame adhesive, front glass, front encapsulant, multi-busbars, back encapsulant [different from front], backsheet [monofacial-polymer, bifacial-glass], PERC [mono- & bifacial], and junction boxes), beyond 2022 (zero-gap interconnects, back encapsulant [cotextured], backsheet [bifacial-glass or transparent polymer], TOPCon or SHJ [bifacial], bifacial one-axis tracker, junction boxes). Trends: Typical module technology of the past (average module power 280 Wp, module size 1.7m2, 99% cell to module power ratio, 0.0 bifaciality factor, 18% cell efficiency), typical recent module technology (average module power 375Wp, module size 2.0 m2, 100% cell to module power ratio, 0.7 bifaciality factor, 22% cell efficiency), example emerging module technology (average module power 500+ Wp, module size 2.5+ m2, 101+% cell to module power ratio, 0.9+ bifaciality factor, and 25+% cell efficiency. Source: ITRPV 2014-2022.](/images/duramatlibraries/project-images/zuboy-et-al-fig-1.webp?sfvrsn=a8ea632f_2)
Crystalline silicon PV module technology trends and impacts.

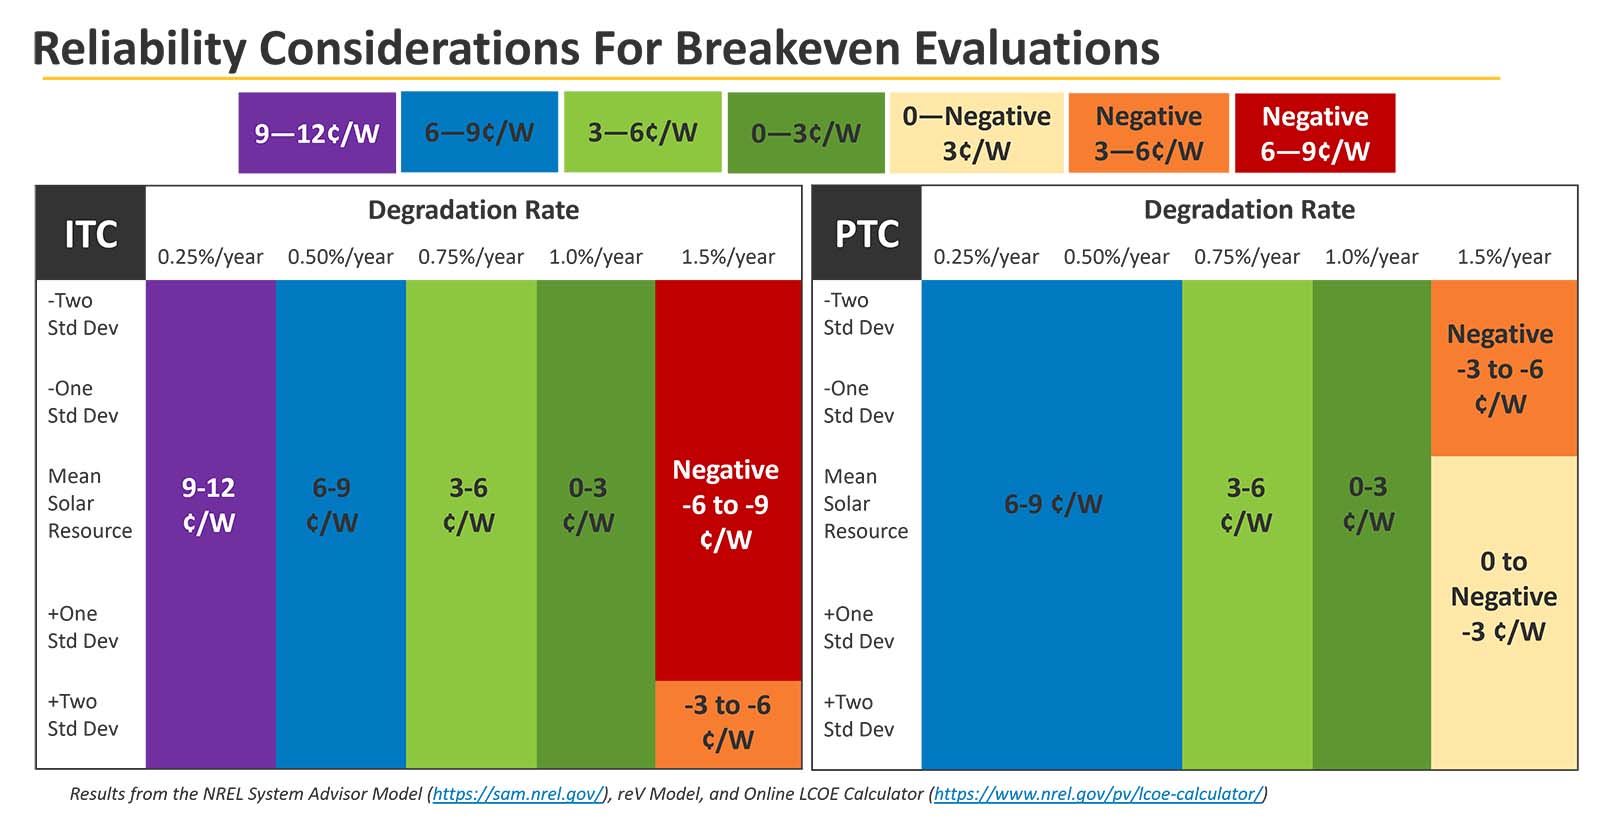
Techno-economic analysis for module technologies based on tax credits, solar resource, and degradation.